archive
Digital Humanities Across the University this Fall
On September 9th, the School of Communication and visiting media artist Philip Mallory Jones will unveil an interactive virtual world exhibit highlighting the Chicago neighborhood of Bronzeville.
Time Machine: Bronzeville and The Chicago Renaissance explores the history, lore, and legends of Bronzeville during the defining events of the 20th century: The Great Migration, The Great Depression, Jim Crow Segregation, World War II, and the emergence of the Black Metropolis.
Dateline: Bronzeville is a mystery adventure computer game where the player acts as Runny Walker, a seasoned photojournalist and columnist for the Chicago Advocate. Bronzeville serves as the news beat for the player, where the weekly column covers the spectrum of social, political, cultural, sport, entertainment, and community events in the area.
Members of the CTSDH community are invited to enjoy drinks and appetizers while hearing from the artist, touring the exhibit, and trying your hand at navigating Bronzeville in the 40s and 50s at a reception on September 9th at 5:30 pm at the School of Communication, 51 E. Pearson Street, Water Tower Campus. To register, click here.
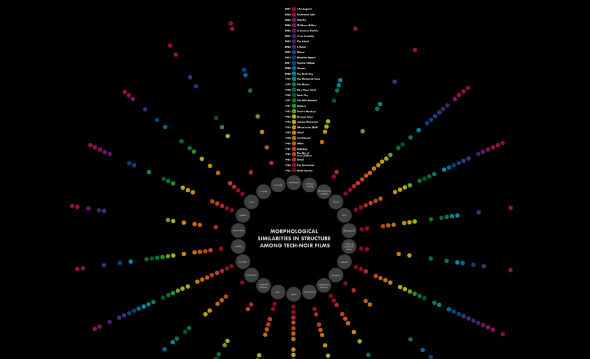
On November 12, a new exhibition, Simplexity: Data Visualization in the Age of Information, curated by Kelli Evans will open in the Ralph Arnold Gallery on the Lakeshore Campus.
Access to prolific amounts of quickly and widely distributed information is a key component of daily life across much of the globe. Unfortunately, our ability to generate information can rapidly overwhelm our capacity to understand it. One of the greatest challenges of the information age involves finding patterns and making meaningful connections from this mountain of data. Data visualization, also known as infographics, is a powerful means of achieving this end. It allows the viewer to access and understand complex information in the form of clear and concise visual representation. Data visualization is a field that combines graphic design with many other disciplines: data analysis, statistical graphics, visual perception, information architecture, and the like. We access and utilize infographics every day without giving much thought to their ubiquity. They can range from the mundane, such as route maps for transit systems, to the more esoteric, such as the depiction of interactions among proteins in a human cell. In 2003, Philippe Compain defined simplexity as “…the combination of simplicity and complexity within the context of a dynamic relationship between means and ends.” This word and concept clearly describes the relationship between our need to understand the deluge of information we encounter everyday with data visualization, the means to do so.
The exhibition runs from November 12, 2015 – January 23, 2016. There is a free opening reception on November 12 from 5-6:30 pm. No registration required.